German Navy Ciphertext by Enigma M3: OJSBI BUPKA ECMEE ZH
German Message: Ziel hafen von DOVER
English Translation: Target port of DOVER
Enigma Mission – X
By running the notebook, it is not difficult to complete the deciphering process with the “keys” to get the original message from the ciphertext by the German Navy.
Notebook Outputs Example
However, it will be difficult to break down the cipher without knowing the keys. That will be the Turing-Welchman Bombe Simulator challenge.
About Enigma Mission X
Mission X is a game for programmers to accomplish the deciphering job required by Dr Alan Turing.
Mission X Letter from Alan Turning
Programmers need to break the secret with limited information as follows.
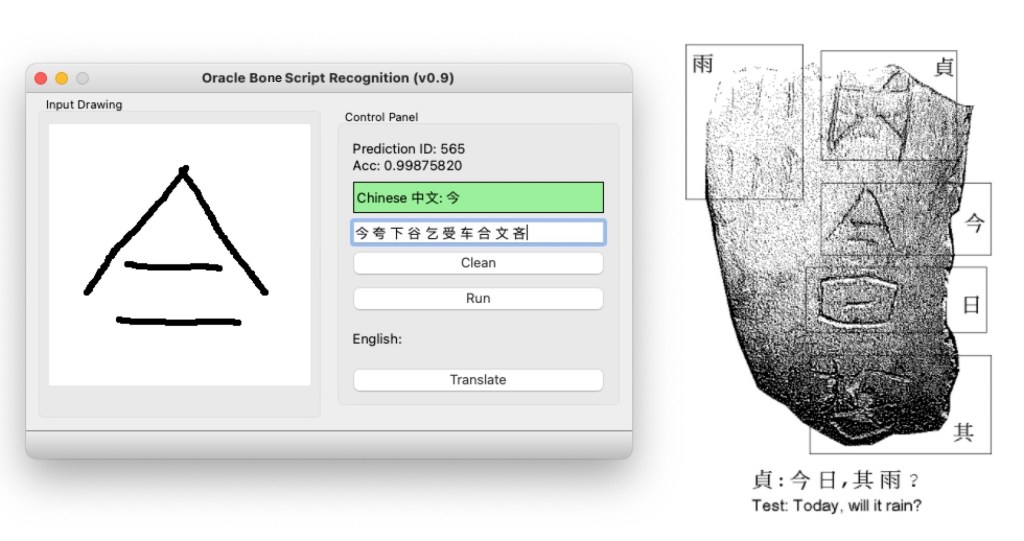
This blog demonstrates how to use Pytorch to build deep convolutional neural networks and use Qt to create the GUI with the pre-trained model. The final app runs like the figure below.
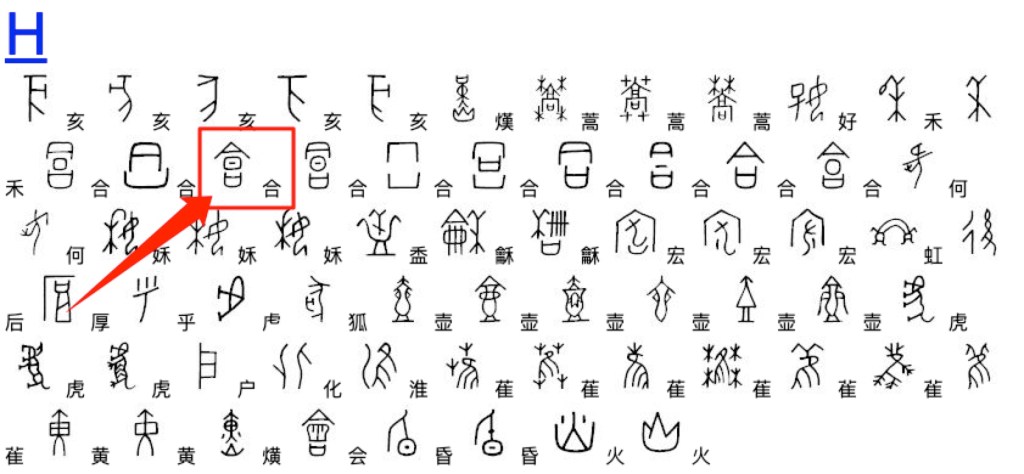
Qt GUI with pre-trained Deep ConvNets model for Oracle Bone Scripts Recognition: Model predicts the Oracle Bone Script ‘合’ with 99.8% Acc.
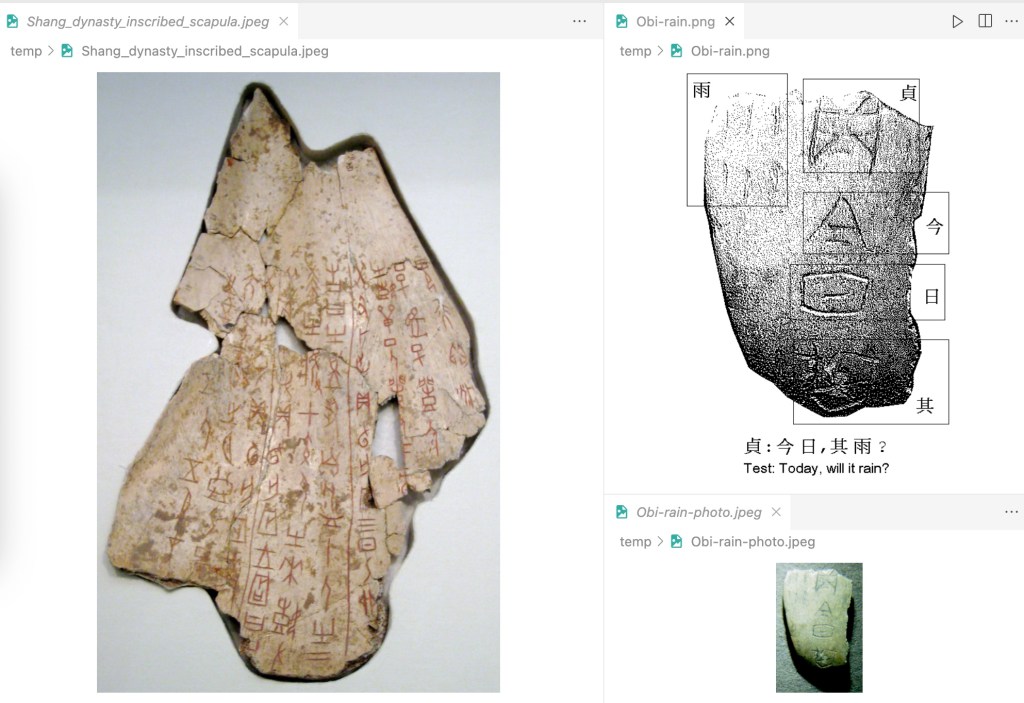
The five original oracle bone scripts in this sample image can be translated into modern Chinese characters as “贞,今日,其雨?” (Test: Today, will it rain?)
Please note that I am not an expert in the ancient Chinese language, and I think the translation may not be that accurate. But in the GUI, the user can draw the script in the input panel and then click the run button to get the top 10 Chinese characters ranked by probabilities. The highest result is presented with green background colour and 99.8% accuracy.
I will assume that readers have a basic understanding of the deep learning model, middle-level skills of python programming, and know a little about UX/UI design with Qt. There are awesome free tutorials on the internet or one could spend a few dollars to join online courses. I see no hurdles for people mastering these skills.
The following sections are arranged with the topics as follows. Explain the basic requirements for this project and then cover all the basic steps in detail:
Init the project
Create the Python Environment and Install the Dependencies
I used cookiecutter package to generate a skeleton of the project.
There are some opinions implicit in the project structure that has grown out of our experience with what works and what doesn’t when collaborating on data science projects. Some of the opinions are about workflows, and some of the opinions are about tools that make life easier.
Data is immutable
Notebooks are for exploration and communication (not for production)
Analysis is a DAG (I used the ‘Makefile’ to create command modules of the workflow)
Build from the environment up
Starting Requirements
conda 4.12.0
Python 3.7, 3.8 I would suggest using Anaconda for the installation of Python. Or you can just install the miniconda package, which saves a lot of space on your hard drive
3. Tutorial Step by Step
Step 1: Init the project
Use ‘git’ command to clone the project from Github.
cd PROJECT_DIR
git clone https://github.com/cuicaihao/deep-learning-for-oracle-bone-script-recognition
# or
# gh repo clone cuicaihao/deep-learning-for-oracle-bone-script-recognition
Check the project structure.
cd deep-learning-for-oracle-bone-script-recognition
ls -l
# or
# tree -h
You will see a similar structure as the one shown in the end. Meanwhile, you could open the ‘Makefile’ to see the raw commands of the workflow.
Step 3: Download the Raw Data and Preprocess the Data
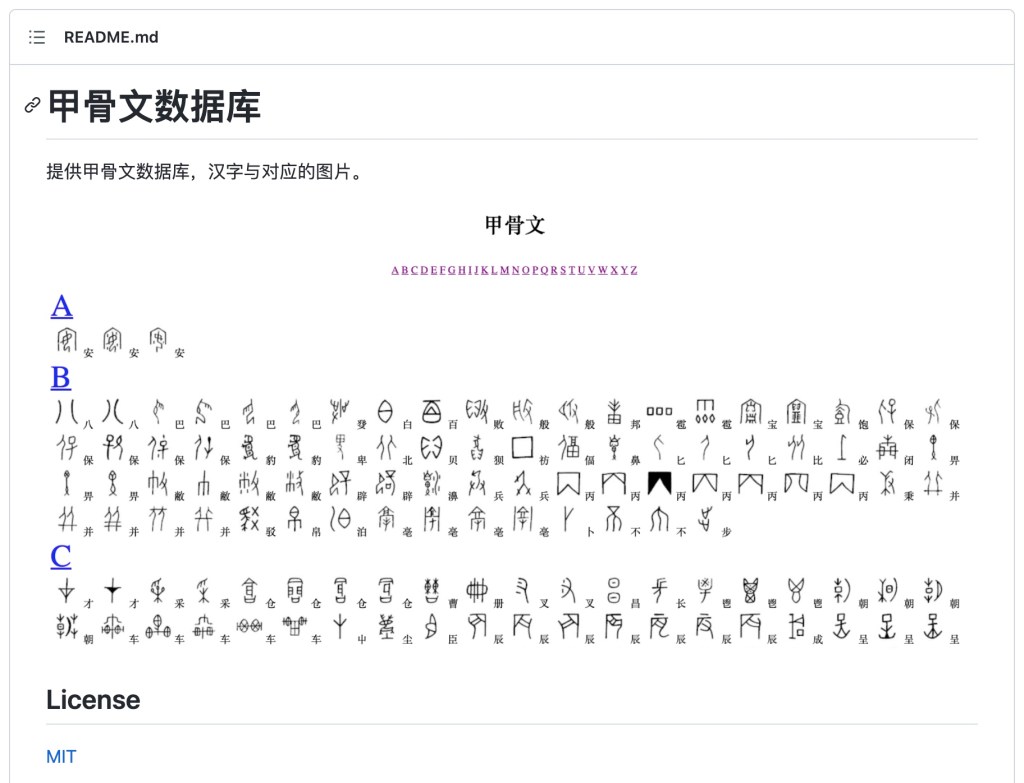
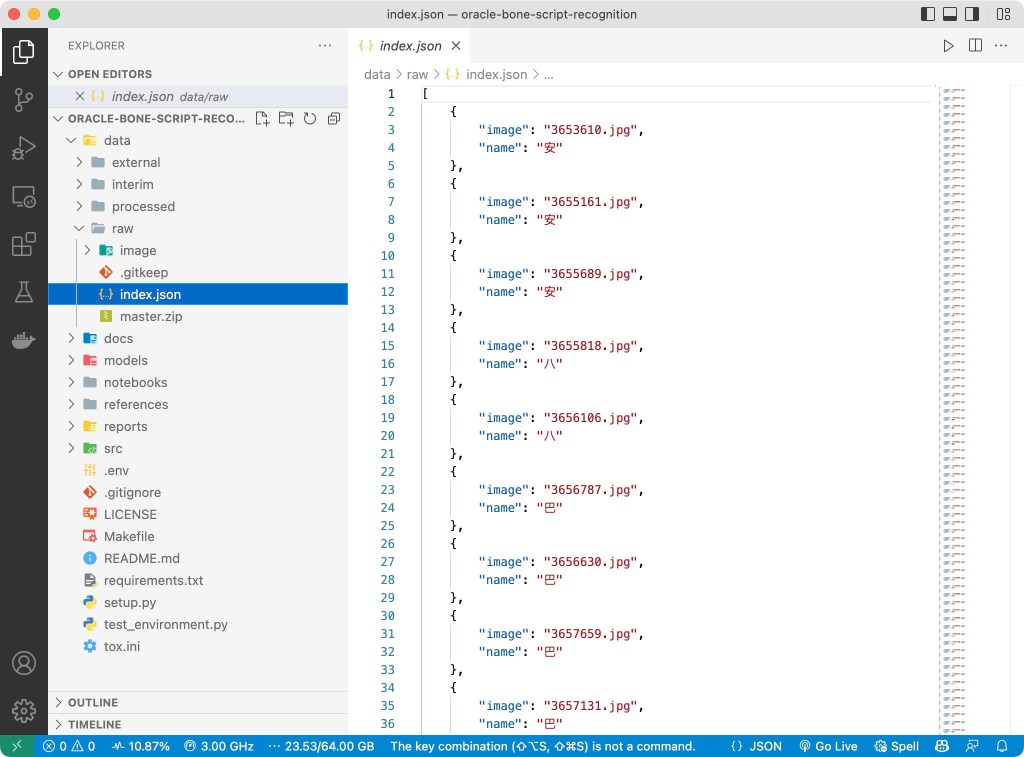
This first challenge is to find a data set with the oracle bone scripts; I found this website 甲骨文 and its GitHub Repo which provided all the script images and image-to-label database I need. The image folder contains 1602 images, and the image name to Chinese character (key-value) pairs are stored in JSON, SQL and DB format, making it the perfect data set for our project startup.
甲骨文网页
we can download the raw data of the images and database of the oracle bone script. Then we will download the raw data and preprocess the data in the project data/raw directory.
make download_data
The basic step is to download repository, unzip the repo, and then make a copy of the images and database (JSON) file to the project data/raw directory.
Then, we preprocess the data to create a table (CSV file) for model development.
make create_dataset
The source code is located at src/data/make_dataset.py. The make command will provide the input arguments to this script to create two tables (CSV file) in the project data/processed directory.
The Raw Data of the Oracle Bone Scripts with the Image-Name Paris.
Step 4: Build the Model with Pytorch
This section is about model development.
4.1 Review Image and DataLoader
Before building the model, we need to review the image and data loader.
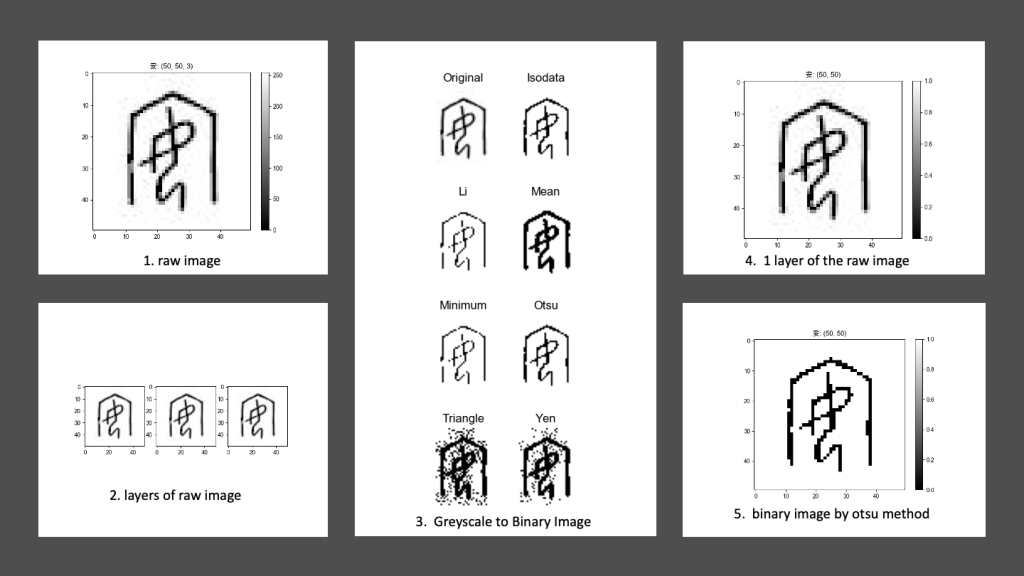
make image_review
This step will generate a series of images of the oracle bone script image sample to highlight the features of the images, such as colour, height, and width.
Besides, we show the results of different binarization methods of the original greyscale image with the tool provided by the scikit-image package.
The source code is located at src/visualization/visualize.py.
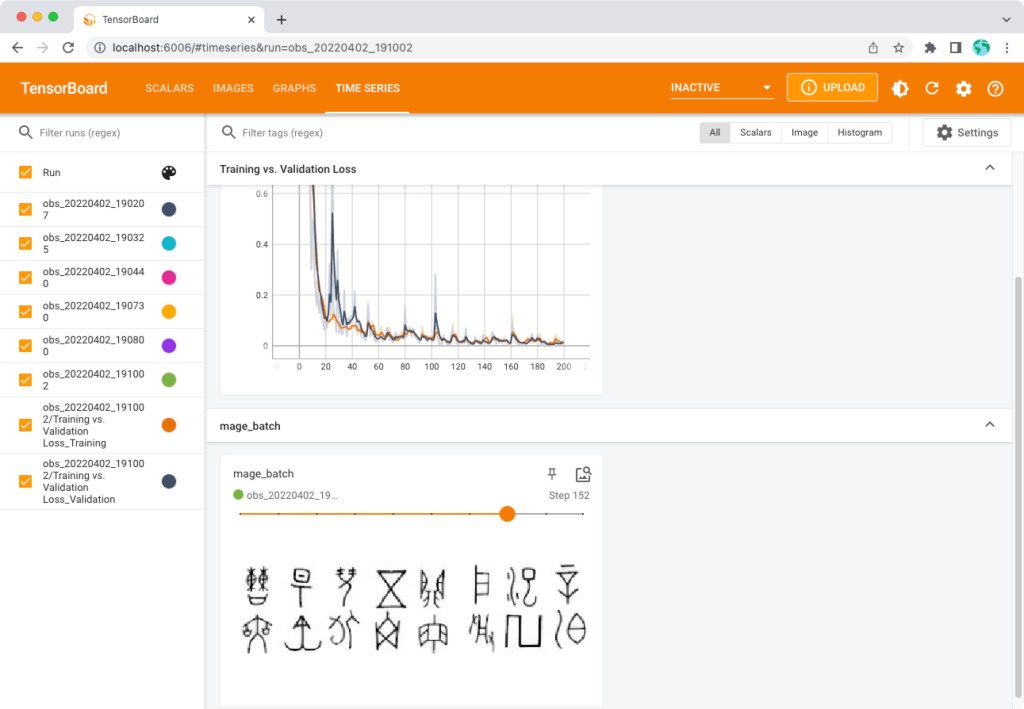
In the image below, it generates a batch of 64 images with its label(Chinese characters) on the top-left corner.
A Batch of 8×8 Grid Images Prepared for Deep ConvNets Model
4.3 Build the Deep Convolutional Neural Networks Model
Now we can build the model. The source code is located at src/models/train_model.py. This command will generate the model and the training process records at models/.
make train_model
(Optional) One can monitor the process by using the tensorboard command.
# Open another terminal
tensorboard --logdir=models/runs
Then open the link: http://localhost:6006/ to monitor the training and validation losses, see the training batch images, and see the model graph.
After the training process, there is one model file named model_best in the models/ directory.
4.4 Test the Model with Sample Image
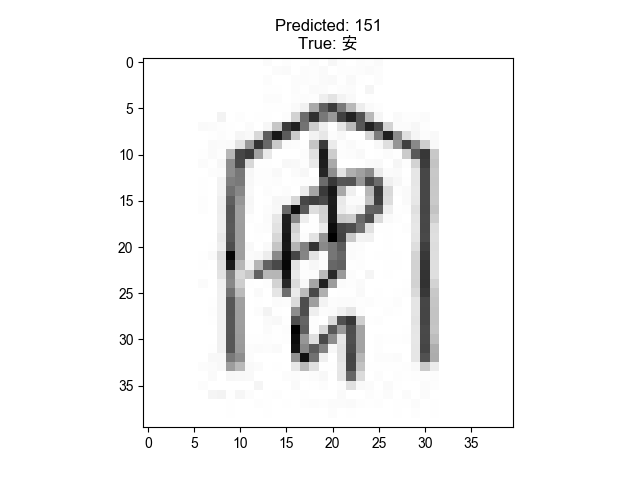
The pre-trained model is located at models/model_best. We can test the model with the sample image. I used the image (3653610.jpg) of the oracle bone script dataset in the Makefiletest_model scripts, readers can change it to other images.
The command will generate a sample figure with a predicted label on the top and a table with the top 10 predicted labels sorted by the probability.
Model Prediction Label and Input Image
Step 5: Test the Model with Qt-GUI
Now, we have the model, we can test the model with the Qt-GUI. I used Qt Designer to create the UI file at src/ui/obs_gui.ui. Then, use the pyside6-uic command to get the Python code from the UI file `pyside6-uic src/ui/obs_gui.ui -o src/ui/obs_gui.py.
The GUI contains an input drawing window for the user to scratch the oracle bone script as an image. After the user finishes the drawing and clicks the RUN button. The input image is converted to a tensor (np.array) and fed into the model. The model will predict the label of the input image with probability which is shown on the top Control Panel of the GUI.
Text Label 1: Show the Chinese character label of the input image ID and the Prediction Probability. If the Acc > 0.5, the label background colour is green; if the Acc < 0.0001, the label background colour is red. Otherwise, the label background colour is yellow.
Test Label 2: Show the top 10 predicted labels sorted by the probability.
Clean Button: Clean the input image.
Run Button: Run the model with the input image.
Translate Button: (Optional) Translate the Chinese character label to English. I did not find a good Translation service for a single character, so I left this park for future development or for the readers to think about it.
4 Summary
This repository is inspired by the most recent DeepMind’s work Predicting the past with Ithaca, I did not dig into the details of the work due to limited resources.
I think the work is very interesting, and I want to share my experience with the readers by trying a different language like Oracle Bone Scripts. It is also a good starter example for me to revisit the PyTorch deep learning packages and the qt-gui toolboxes.
I will be very grateful if you can share your experience with more readers. If you like this repository, please upvote/star it.
Conclusion
I made a formal statement on my GitHub on the first day of 2022, claiming that I would create 10 blogs on technology, but I got flattened by daily business and other work. But be a man of his word, I made my time to serve the community. Here comes the first one.
If you find the repository useful, please consider donating to the Standford Rural Area Education Program (https://sccei.fsi.stanford.edu/reap/): Policy change and research to help China’s invisible poor.
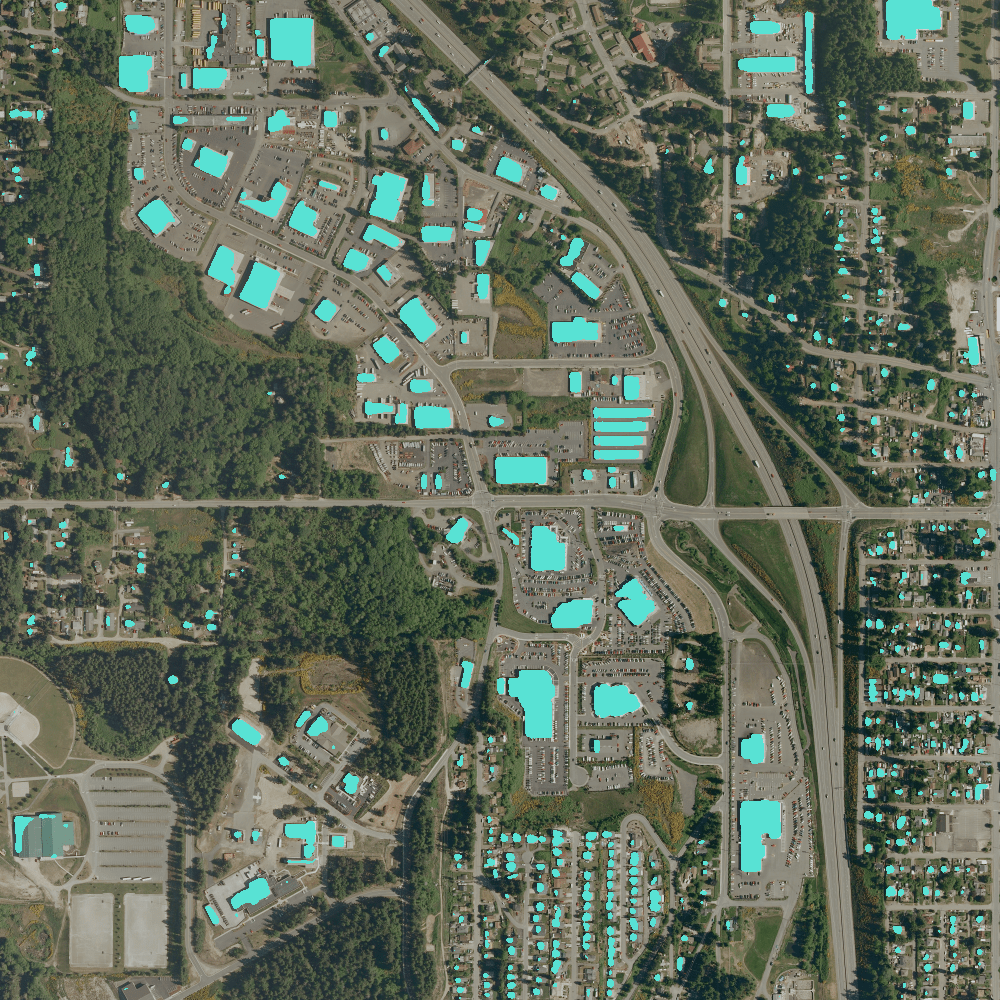
Aerial Image Labeling addresses a core topic in remote sensing: the automatic pixel-wise labelling of aerial imagery. The UNet leads to more advanced design in Aerial Image Segmentation. Future updates will gradually apply those methods to this repository.
I created the Github Repo used only one sample (kitsap11.tif ) from the public dataset (Inria Aerial Image Labelling ) to demonstrate the power of deep learning.
The original sample has been preprocessed into 1000×1000 with a 1.5-meter resolution. The following image shows the models prediction on the RGB images.
Programming details are updated on Github repos.
Dataset Features
The Inria Aerial Image Labeling addresses a core topic in remote sensing: the automatic pixel-wise labelling of aerial imagery (link to paper). Coverage of 810 km² (405 km² for training and 405 km² for testing) Aerial orthorectified colour imagery with a spatial resolution of 0.3 m Ground truth data for two semantic classes: building and not building (publicly disclosed only for the training subset) The images cover dissimilar urban settlements, ranging from densely populated areas (e.g., San Francisco’s financial district) to alpine towns (e.g,. Lienz in Austrian Tyrol).
Instead of splitting adjacent portions of the same images into the training and test subsets, different cities are included in each of the subsets. For example, images over Chicago are included in the training set (and not on the test set) and images over San Francisco are included on the test set (and not on the training set). The ultimate goal of this dataset is to assess the generalization power of the techniques: while Chicago imagery may be used for training, the system should label aerial images over other regions, with varying illumination conditions, urban landscape and time of the year.
The dataset was constructed by combining public domain imagery and public domain official building footprints.
Notification
The full data set is about 21 GB. In this repo, I select the following image as examples:
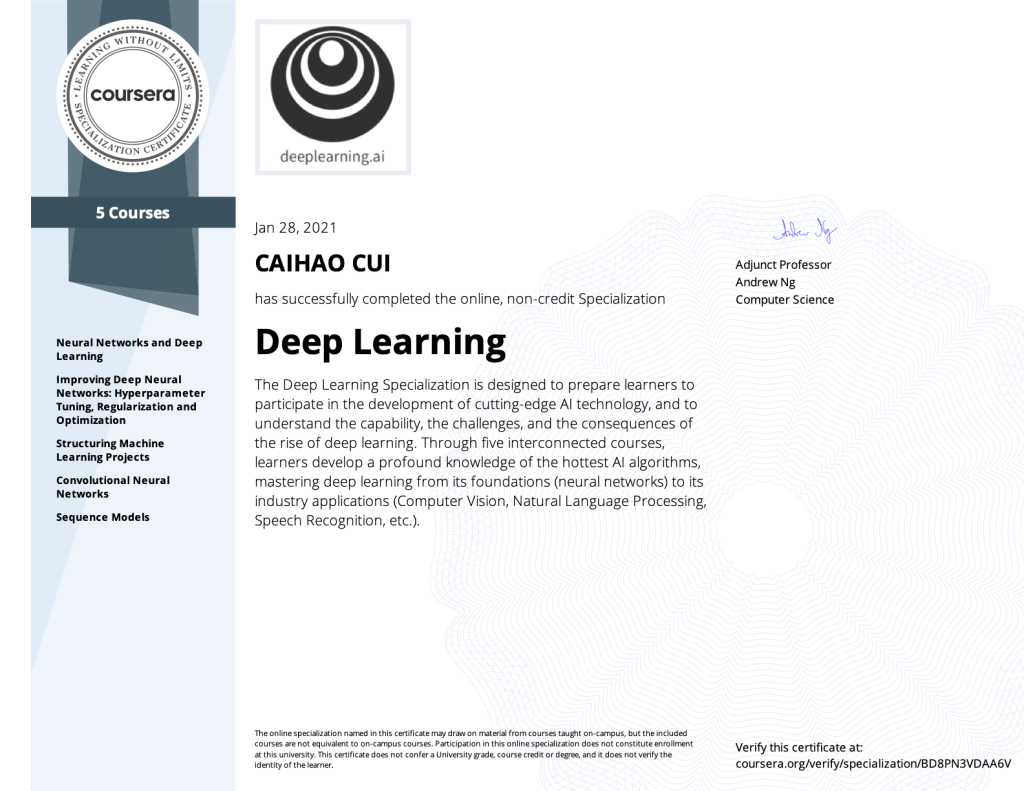
In five courses, you are going learn the foundations of Deep Learning, understand how to build neural networks, and learn how to lead successful machine learning projects. You will learn about Convolutional networks, RNNs, LSTM, Adam, Dropout, BatchNorm, Xavier/He initialization, and more. You will work on case studies from healthcare, autonomous driving, sign language reading, music generation, and natural language processing. You will master not only the theory, but also see how it is applied in industry. You will practice all these ideas in Python and in TensorFlow, which we will teach.
In this post, I would like to share my practice with Facebook’s new Detectron2 package on macOS without GPU support for street view panoptic segmentation. If you want to create the following video by yourself, this post is all you need. This demo video clip is from my car’s dashcam footages from Preston, Melbourne. I used the PyTorch and Detectron2 to create this video with segmentation masks.
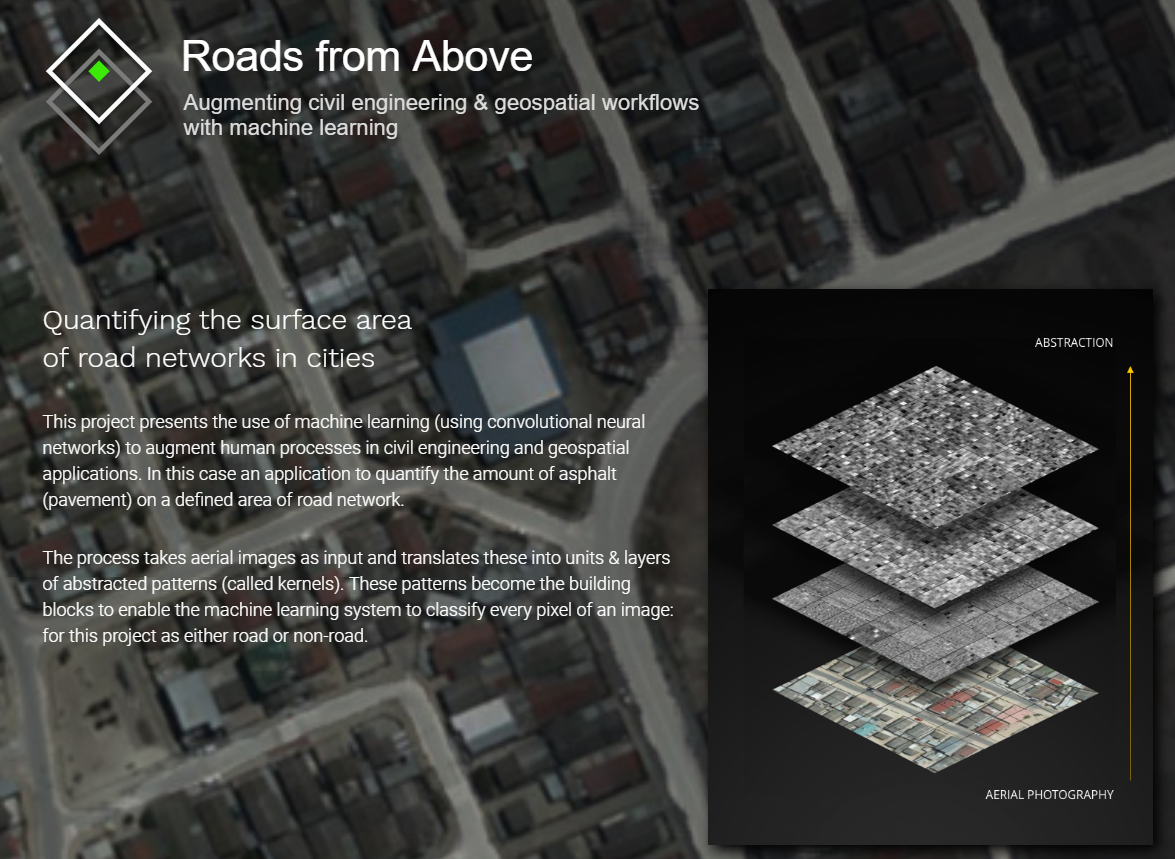
Road from Above is partly based on my Australia Postgraduate Intern Projects (Computer Vision and Machine Learning for Feature Extraction) within Aureon Group in Melbourne.
Aurecon’s experts, across Cape Town, Melbourne and Auckland offices, have been teamed up to develop and test approaches that capture and validate new and existing measurements of the metropolitan road network. Due to the confidentiality, we reduced the resolutions of the aerial images and only opened limited results on the public domain at https://roadsfromabove.netlify.com/. Thanks to Greg More, the design of this website got the best feedback from the workshop (Visualization for AI Explainability) of the IEEE VIS 2018 conference in Berlin, Germany
Visualization for AI Explainability: Projections and Dimensionality Reduction.The goal of this workshop is to initiate a call for “explainable” that explain how AI techniques work using visualizations. We believe the VIS community can leverage their expertise in creating visual narratives to bring new insight into the often obfuscated complexity of AI systems.
When I am using TensorFlow on my MacBook Air, I always get annoyed by the warnings comes from nowhere, so I followed the documentation below to build TensorFlow sources into a TensorFlow binary and installed it successfully. In theory, this will make the TF running faster on my machine.