
In complex engineering projects, project failures often stem from incorrect execution sequences. In the early stages, engineering teams often rely too heavily on Gantt charts for detailed schedules, only to encounter frequent reworks and delays during execution. The root cause is the lack of a rigorous task dependency structure design.
The division of labor between requirements analysis, Design Structure Matrix (DSM), and Gantt charts is crucial.
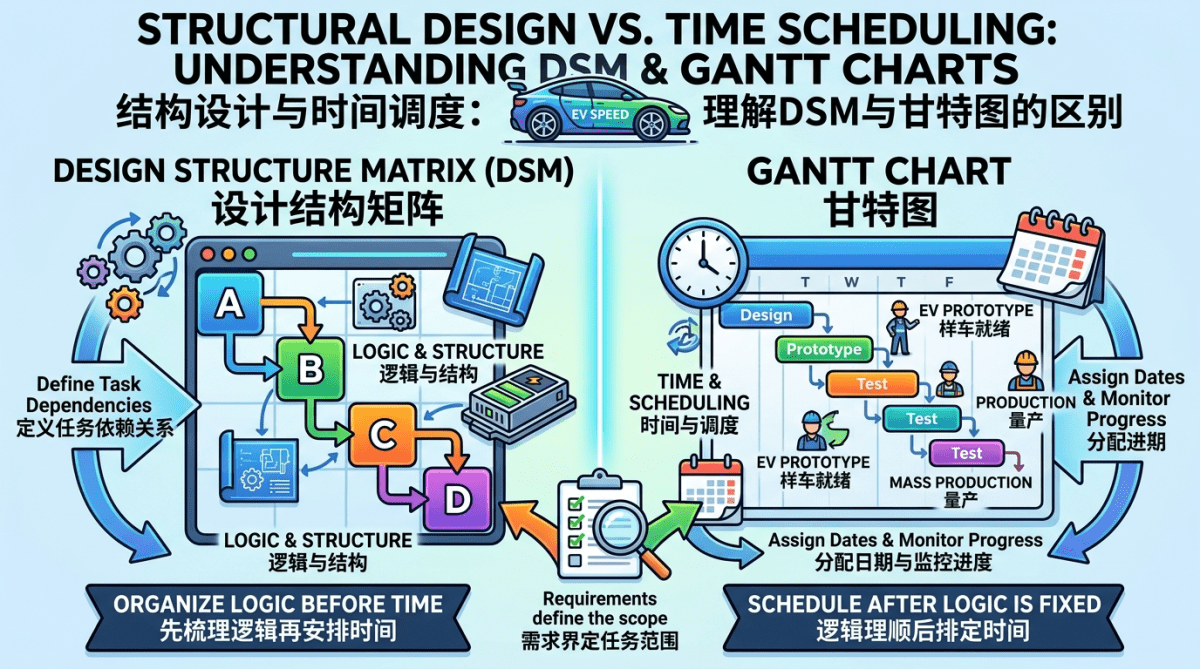
Core Conclusion: Requirements define the scope, DSM organizes the logic, and Gantt charts handle the time scheduling.
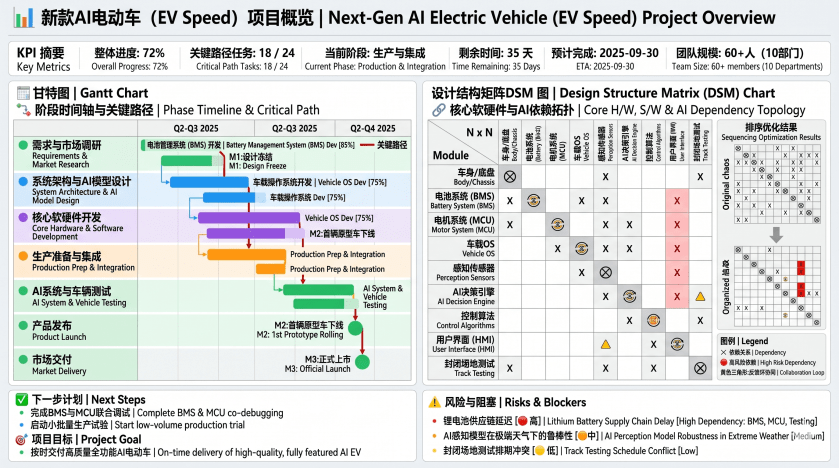
We use an EV Speed project as an example here. (The “EV Speed” initiative functions as a conceptual schema to architect the structural narrative and facilitate coherent technical exposition throughout the documentation.)
中文版本:设计结构矩阵与甘特图的本质区别:结构设计 vs 时间调度
- I. Prerequisite: Clarify Project Requirements
- II. Design Structure Matrix (DSM): Sorting Out the “Structure” First
- III. Gantt Chart: Arranging the “Time” Next
- IV. Essential Differences: Requirements vs. Structure vs. Time
- V. Why the Sequence is Irreversible
- VI. Practical Suggestions (Applicable to complex projects like EV Speed)
- Conclusion
- Reference
Video and Audio are supported by NotebookLM
The Logic of Order: Integrating DSM and Gantt Charts
I. Prerequisite: Clarify Project Requirements

Before making any plan, engineers must clarify the ultimate goal of the project. Without accurate requirements input, subsequent schedule planning is meaningless.
1. The Core Role of Requirements Engineering
The requirements analysis phase needs to answer a fundamental question: What specific functions does the system need to deliver?
Standard operating procedures:
- Identify core metrics: Lock in key data for the EV Speed project (e.g., cruising range).
- Decompose specific tasks: Break down macro goals into executable micro steps.
- Set acceptance criteria: Define specific engineering specifications for each task completion.
2. Connection Between Requirements and Subsequent Tools
Clear engineering requirements provide a complete task list:
- The requirements phase identifies all tasks to be done.
- The structural analysis phase clarifies the dependencies between tasks.
- The Gantt chart phase assigns specific dates to individual tasks.
Without clear project requirements, DSM analysis will miss key steps.
II. Design Structure Matrix (DSM): Sorting Out the “Structure” First
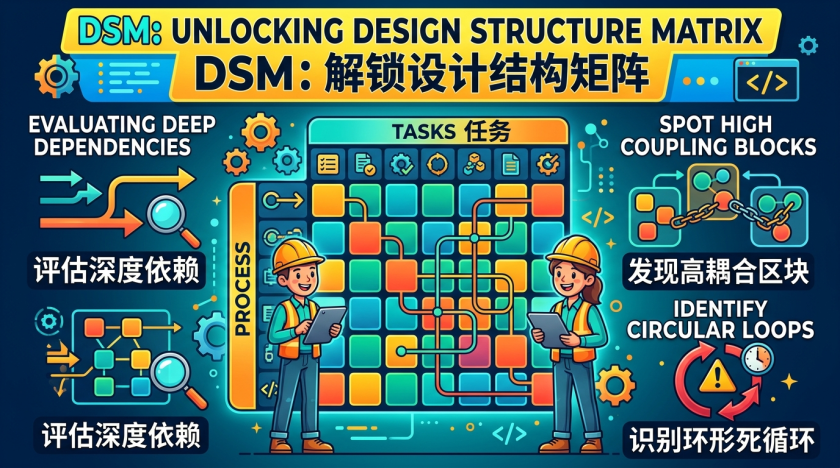
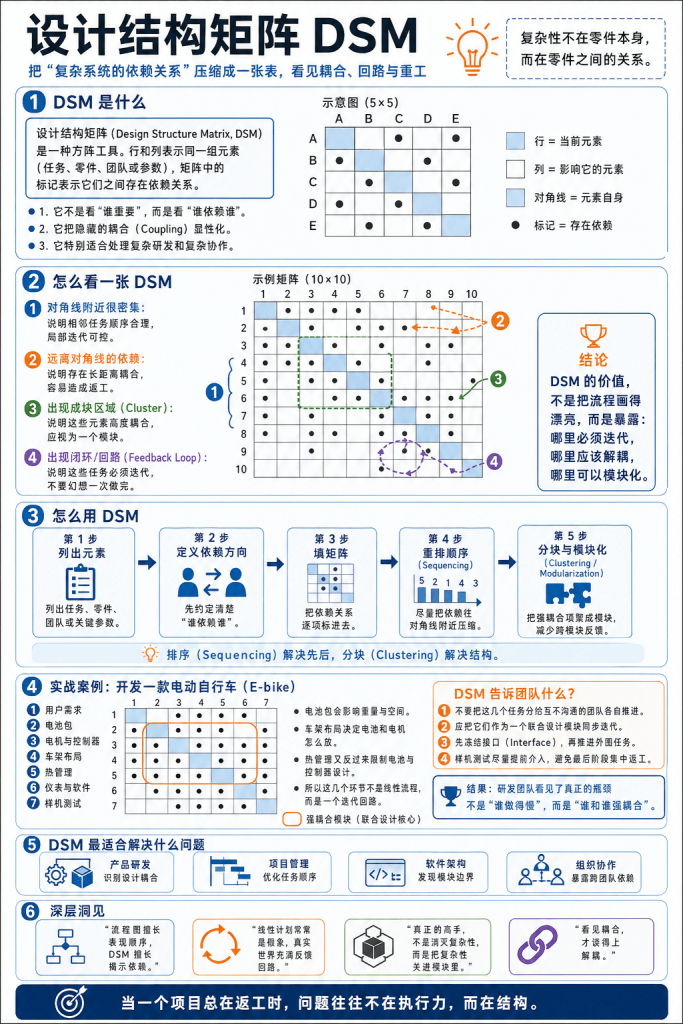
DSM solves the underlying logical architecture problem: How do tasks depend on each other? Is the sequence reasonable?
1. Operational Mechanism
Engineers can understand this matrix as a “task dependency map.”
Basic approach:
- List all decomposed tasks (e.g., battery management, system software).
- Enter task names on both the horizontal and vertical axes of the table.
- Mark the information transfer relationships between tasks at the intersections.
This table clearly demonstrates the operational logic within a complex system.
2. Assessing Structural Rationality
The value of the matrix lies in checking the health of the project’s logical structure.
Key assessment methods:
- Diagonal Concentration: Tasks progress smoothly in order, and the engineering flow is extremely efficient.
- Long-distance Dependencies: There are mutual waits across stages, requiring a readjustment of the work order.
- High-coupling Blocks: Multiple tasks are intertwined and need to be handled by an independent technical group.
- Circular Deadlocks: There are closed loops of repeated modifications between tasks, requiring early planning for multiple iterations.
3. Core Issues Solved
DSM does not focus on specific dates; it only optimizes the internal logic:
- Reducing chaotic information transfer across development stages.
- Significantly reducing the probability of technical rework in the later stages of the system.
- Defining clear and reasonable boundaries for engineering team collaboration.
- Identifying core R&D links that must be repeatedly tested and optimized.
III. Gantt Chart: Arranging the “Time” Next
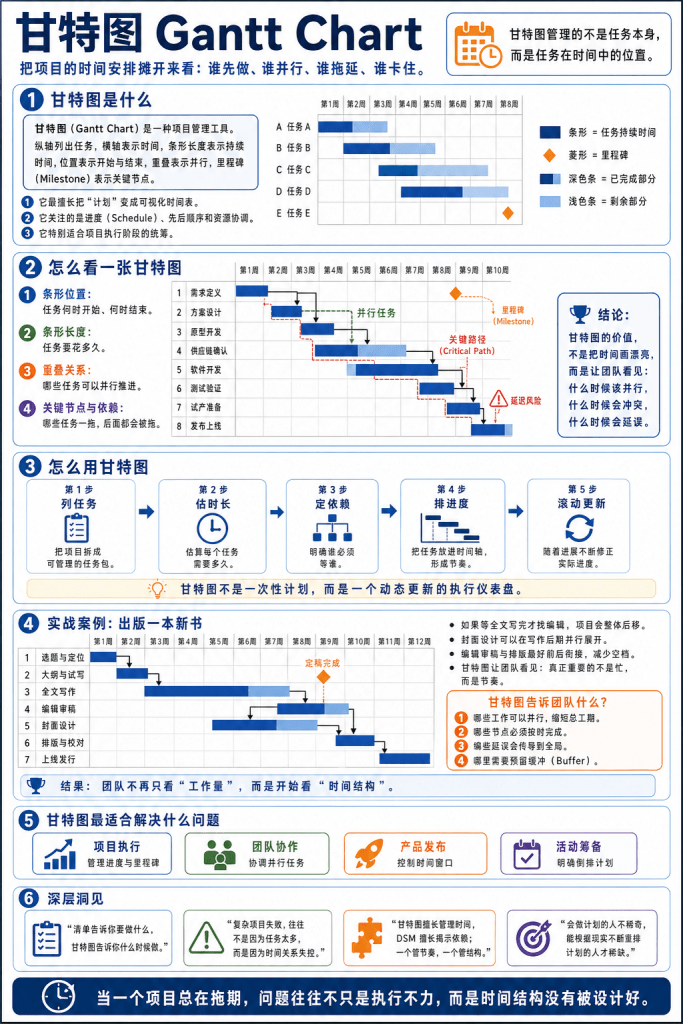
Only after the logical relationships are completely sorted out is it the Gantt chart’s turn.
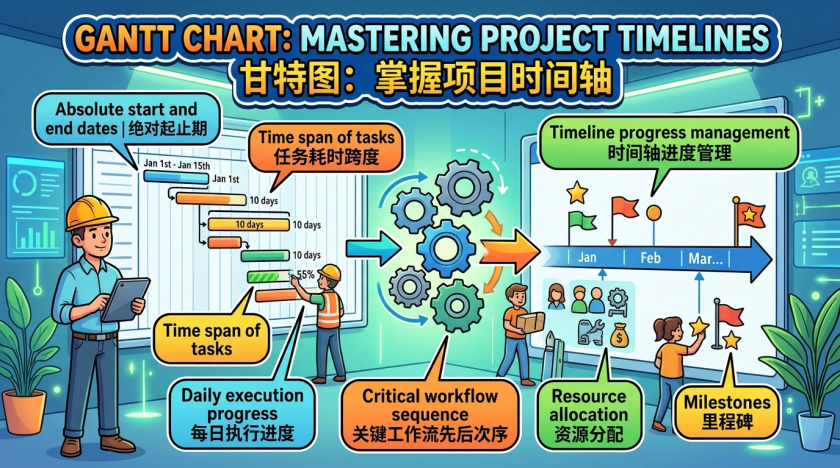
The Gantt chart primarily solves: When will each task start? How long will it take?
1. Core Functions
- Set absolute start and end dates for engineering tasks.
- Visually display the time span of individual tasks.
- Mark the execution sequence on critical workflows.
- Monitor daily execution progress and delivery delay risks.
Example of EV Speed project scheduling:
- Battery development → Software adaptation → Vehicle integration testing.
- Establish key milestones such as design freeze, engineering prototype, and mass production release.
2. Focus Points
Gantt charts focus on timeline progress management:
- When the R&D team is ready to start.
- How long equipment resources need to be occupied.
- The impact of a delay in one link on the final product delivery date.
Essential positioning: A tool for time scheduling and project progress monitoring.
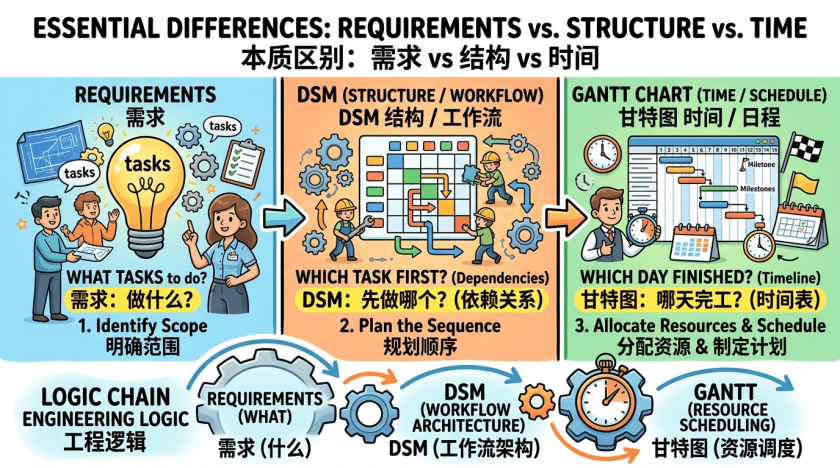
IV. Essential Differences: Requirements vs. Structure vs. Time
Briefly summarize the division of logic among the three engineering management tools:
- Requirements Engineering: Determines what tasks the development team needs to do.
- Design Structure Matrix: Determines which task to do first and which to do next.
- Gantt Chart: Determines on which day the engineering plan will be completely finished.
Engineering logic chain: Requirements determine the development object. DSM determines the workflow architecture. Gantt chart determines the resource scheduling timing.
V. Why the Sequence is Irreversible

Skipping requirements and structural design to go straight to Gantt chart scheduling will lead to engineering disasters:
- Missing hidden prerequisites, leading to complete reworks later.
- Time assessments are completely inaccurate, making the schedule plan useless.
- Modifying the critical path of project R&D every day.
If the EV Speed project does not clarify the dependency logic:
- Software and hardware R&D teams wait for each other to deliver data.
- Autonomous driving algorithms fail to receive underlying sensor information.
These hidden dangers will inevitably explode during the final vehicle integration test.
VI. Practical Suggestions (Applicable to complex projects like EV Speed)
1. Strictly Follow the Correct Sequence
When facing a complex system, first answer “which tasks to do.” Then clarify “who depends on whom.” Finally, fill in “specific delivery dates.”
2. Batch Intertwined Modules
When encountering intertwined task areas in the matrix table:
- Encapsulate highly related tasks as an independent sub-project task force.
- Allow high-frequency, rapid engineering trial and error within the group.
- Require the group to provide stable and standardized module test results.
Example operation: Merge battery management and motor control into a Power Train R&D group.
3. Dedicated to Early-stage Design
DSM application scenarios:
- Early system conceptual design phase.
- Boundary division between R&D teams and technical modules.
- Early planning of engineering technology roadmaps.
Do not use it as a tool for daily check-in progress scheduling.
4. Dedicated to Later-stage Execution
Gantt chart application scenarios:
- Allocation of R&D team resources over time periods.
- Establishment of key engineering milestone dates.
- Tracking of daily technical development progress.
Do not use Gantt charts to design the underlying architecture of the system.
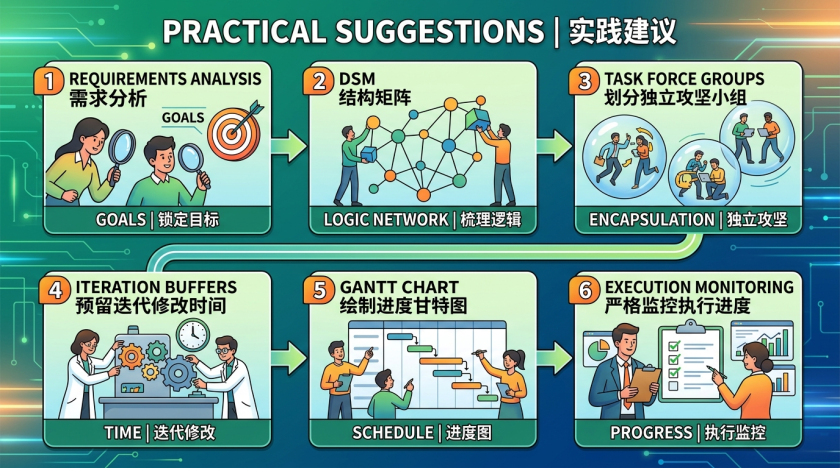
5. Recommended Standardized Workflow
- Lock in all project R&D goals through requirements analysis.
- Use the DSM table to sort out the underlying R&D logic network.
- Divide complex and intertwined R&D tasks into independent task forces.
- Reserve time for repeated iterations and modifications in advance.
- Draw the project progress Gantt chart based on the organized logical framework.
- Strictly monitor the technical team’s execution progress according to the calendar.
Conclusion
In a complex engineering system, the correct execution sequence is the cornerstone of project success.
First clarify the final business goal, then lay the system logical track, and finally start the train according to the calendar.
By following scientific engineering logic, the progress schedule will have true execution value.
Reference
DSM infographic
Gantt Chart infographic
END
